Technical Analysis
-
Advanced Technical Analysis: A Guide to High Probability Trading by Aligning with Smart Money
****Amazon allows spam and inaccurate reviews so please read verified purchase reviews before making a decision****Jonathon, or simply Jon, has been trading various markets such as stocks, currencies, options, futures, and commodities since early 2014. His limited free time in the United States Navy (2014 – 2018) was spent studying charts and playing video games. He shares his experience and opinions with other aspiring traders so they may find a better chance of success than relying on their own. You can find his Instagram profile @jonfibonacci.
Read more
£22.90 -
Chart Logic – Technical Analysis Handbook (Black and White Edition): The Comprehensive Guide to Trading Cryptocurrencies and Tools to Outperform Your Basic Buy and Hold Investor
The A-Z Guide to Trading Cryptocurrencies:
- Learn all procedure, technical analysis, and essential trade strategies necessary to trade crypto markets with confidence and discipline.
- Chart Logic is the only resource for statistical performance of commonly occurring chart patterns in the cryptocurrency markets.
- Study theory and strategies for all market conditions and adopt an evidence-based approach to tackling each trade.
Chart Logic is the comprehensive guide for anyone wishing to learn to trade cryptocurrencies and offers experienced traders a go-to technical analysis refresher with unique insights. The handbook covers core concepts of cryptocurrencies and walks traders through wallets, exchanges, and trade procedure; trader terminology and technical analysis techniques; and extensive strategies and theory. Together, the procedure, technical skill-building, and essential trade strategies create the holy trinity necessary trade cryptocurrency markets with confidence and discipline. Best of all, it’s written simply and eloquently so anyone can learn to trade!
Taken from five years of successful trading, the author, a lawyer turned crypto-fanatic, teaches crypto-centric interpretations of classical technical analysis and offers useful insights into the highly volatile cryptocurrency markets. R.S. Varnes leverages his pragmatism and strategic thinking from his legal background to profitably trade cryptocurrencies and teaches in a manner suitable for all readers. Traders will learn a structured and evidence-based trade approach, and this handbook emphasizes techniques to profit under all market conditions maximizing both long-term and short-term gains. All examples are carefully cherry-picked from the cryptocurrency markets and many reflect real trades and applications.
Notably, Chart Logic also offers the first chart pattern performance statistics specific to the cryptocurrency markets (both for Bitcoin and USD traded pairs), and the handbook is peppered with data-driven insights. All top 100 cryptocurrencies were examined and nearly 400 charts and 1,800 patterns were sourced for analysis. While, in the spirit of transparency and knowledge sharing, all charts and some of the findings are public for all traders to see at Chartlogic.io, handbook readers get exclusive additional statistics, insights, analysis, and detailed finding summaries for each pattern.
Readers can go from never having used a cryptocurrency or seen a technical chart before to actively trading, mastering chart construction, and building confidence in essential technical analysis techniques. The technical methodology includes fluency in fundamental candlestick formations, chart patterns, trend lines, momentum gauges and divergences, and more. Furthermore, Chart Logic includes strategies and theory covering risk management, tactics for trading different types of cryptocurrencies, Bitcoin’s impact on altcoins, avoiding gamblers’ mentality, dealing with losses, and other useful insights every crypto trader can appreciate.
About the Author:
R.S. Varnes holds a Juris Doctor and Master of Arts from the American University in Washington, DC. In 2016, he passed the esteemed California Bar Examination and was admitted to practice law; however, in 2020, he chose to switch from active attorney status to voluntary inactive status. R.S. has been mining and profitably trading cryptocurrencies since 2015. What started as a law school hobby turned into a passion and full-time career. He credits his success in the cryptocurrency markets to his methodical trade approach formed from the groundwork of his legal training. As you will see, he takes an evidence-based approach using multiple indicators to corroborate or dispel trade theories.
Read more
£9.70 -
Evidence-Based Technical Analysis: Applying the Scientific Method and Statistical Inference to Trading Signals: 274 (Wiley Trading)
Evidence-Based Technical Analysis examines how you can apply the scientific method, and recently developed statistical tests, to determine the true effectiveness of technical trading signals. Throughout the book, expert David Aronson provides you with comprehensive coverage of this new methodology, which is specifically designed for evaluating the performance of rules/signals that are discovered by data mining.Read more
£73.90£79.80 -
Technical Analysis FD 3e (For Dummies Series)
A simple, straightforward guide to the fundamentals of technical analysis Technical analysis is a collection of techniques designed to help you make trading decisions in securities markets. Technical Analysis For Dummies helps you take a hard-headed look at what securities prices are actually doing rather than what economists or analysts say they should be doing, giving you the know-how to use that data to decide whether to buy or sell individual securities. Since the publication of the first edition, readers have been faced with many changes, such as new interest rates, looming bank crises, and adjusting market climates. This new edition provides an updated look at unique formulas and key indicators, as well as refreshed and practical examples that reflect today today’s financial atmosphere. * Determine how markets are performing and make decisions using real data * Spot investment trends and turning points * Improve your profits and your portfolio performance With straightforward coverage of concepts and execution, Technical Analysis For Dummies shows you how to make better trading decisions in no time.Read more
£4.70 -
Technical Analysis for day trading: Introduction to trading world. How short term traders make profits from the market
★★★Technical Analysis for day trading: introduction to trading world. How short term traders make profits from the markets★★★
Are You Looking to Learn how to Make Money From Trading? If your answer is yes, This book will Definitely Help you out!
This book introduces you to technical analysis, what it is and how to use it to make money in any market you want: stock, gold, cryptocurrency…
Technical analysis is the study of the market primarily through the use of charts. And we come up with strategies in which we can make money in the market.
But… Technical analysis is not absolute, it’s a common misconception that technical analysts are able to forecast what the price is going to do. This couldn’t be further from the truth. What technical analysts can actually do is determine probabilities of the price doing certain things based on our previous two assumptions that human psychology leads to probable repetitions of the past and that all information is reflected in the price. So it’s not an exact science but more a combination of an artist science and a bit of common sense as well.
This is what you will get after reading this book:
◆How to actually make money Trading – Introduction to Technical Analysis.
◆How to Mastering Candlestick Charts.
◆Use basic yet effective indicators for technical analysis like Support and Resistance, Moving Average…
◆And finally, how to put it all together to structuring your own analysis framework that can help you consistency making money in the market.
Trading is hard and there is no guarantee of you being profitable. However this book will gives you an overview of the trading industry and the best chance to get started. Are you ready to actually make money trading? Now is the perfect time. Grab your copy now by clicking “Buy Now With 1-Click” Button.
Read more
£6.90 -
Technical Analysis of the Financial Markets: A Comprehensive Guide to Trading Methods and Applications
John J. Murphy has updated his landmark bestseller Technical Analysis of the Futures Markets, to include all of the financial markets.This outstanding reference has already taught thousands of traders the concepts of technical analysis and their application in the futures and stock markets. Covering the latest developments in computer technology, technical tools, and indicators, the second edition features new material on candlestick charting, intermarket relationships, stocks and stock rotation, plus state-of-the-art examples and figures. From how to read charts to understanding indicators and the crucial role technical analysis plays in investing, readers gain a thorough and accessible overview of the field of technical analysis, with a special emphasis on futures markets. Revised and expanded for the demands of today’s financial world, this book is essential reading for anyone interested in tracking and analyzing market behavior.
Read more
£49.90 -
Technical Analysis Using Multiple Timeframes : Get A Customized Indicator And Trading Journal And Start Trading Like A Pro. New Age Trading Secrets For Every Serious Trader
Simple Charting And Technical Analysis Trading BookHello Trader,
Are you searching for a comprehensive guide to mastering technical analysis using multiple timeframes in forex trading? This book, “Technical Analysis Using Multiple Timeframes,” is an excellent resource to consider.
This book offers a detailed and practical approach to analyzing price charts across different timeframes. You’ll learn how to identify trends, key resistance and support levels, and entry and exit points using different charting techniques.
The book includes numerous examples that illustrate applying these techniques in real-world trading. You’ll also learn how to manage risk and improve your trading psychology, which are crucial elements of successful forex trading.
Whether you’re an experienced or a novice trader, “Technical Analysis Using Multiple Timeframes” provides valuable insights and practical strategies to assist you in becoming a more effective trader.
This book comes with a trading journal and a customized indicator that will help make you trade profitably and accurately.
Note: This indicator is only available for All paperback and hardcopy buyers.
Happy Trading!!
Read more
£29.90 -
Technical Analysis: Is Mostly Bullshit – Why Flipping a Coin is a Better Strategy than Using Technical Analysis in the Financial, Stock, and Forex Markets
▬▬▬▬▬▬▬▬▬▬▬▬▬
What If Technical Analysis Is a Lie?
▬▬▬▬▬▬▬▬▬▬▬▬▬As In Something That Doesn’t Work and Never Has…
Look at all the courses on the internet claiming you will be a millionaire from using Technical Analysis! How someone with just $500 in their bank account made a $100,000 in 3 days. And all you have to do is look for a pattern on a chart and follow their advice. Seem too good to be true… that’s because it is!
Hi, my name is Tim Morris. I’ve been trading stocks for many years, and have a great bit of experience in the markets. I’m here today to cut through the lies, and give you the cold hard truth about technical analysis. The truth other “educators” won’t tell you. The truth you deserve to know. That technical analysis is complete bullshit!
Here’s What You’ll Learn In This Book:
- Introduction: My Story – Before the book begins, I share with you my own roller coaster experience with technical analysis, and how I stumbled upon the information that I reveal in this book. The information that confirmed my suspicions that technical analysis is, and always has been, bullshit.
- Chapter 1: Analyzing the Markets – First we go over the main ways traders are taught how to analyze the markets and make money in stocks. This would include both fundamental and technical analysis, as well as a few other hypotheses that have been proposed about how the stock market operates.
- Chapter 2: Classic Technical Analysis – In this chapter, I explain the way classic technical analyze is taught to traders in books, video courses, and subscription services across the web. This includes:
- Patterns – Cup and Handle, Head and Shoulders, Flags, Triangles, Double Tops, and Many More
- Indicators – RSI, MACD, Stochastics, Moving Averages, Bollinger Bands, Divergence, Volume
- Tools – Fibonacci Retracement, Fibonacci Projection, and Elliott Wave Theory
- Chapter 3: The Issues – This is the heart of the book and where I really lay down the hammer. I go over the many flaws that are brazenly apparent in the technical analysis theory, that you’ve likely never heard of.
- Can TA really be used in all time frames?
- Does TA really work in all financial markets?
- Has anyone actually made their money with TA?
- Have the inventors of TA indicators actually made money with their own indicators?
- I reference charts, statistics, and studies, as well as expert testimonial from PhD economists and other traders in the field. *Warning* You will be shocked and stunned by what is revealed in this chapter.
- Chapter 4: The Verdicts – In the last chapter, we go over the final verdicts of each technical analysis tool brought up previously in the book. I explain which tools are worthless, which are plausible, and which actually work. Notice I said mostly bullshit. There are a couple useful tools!
- Bonus Chapter – Japanese Candlesticks
â”â•â”â•â”â•â”â•â”â•â”â•â”
As a FREE bonus, only for book buyers, you’ll receive my special report titled Crush the Market! This report goes over 18 beneficial tips I have learned throughout my trading career that will help keep your account profitable in the stock market. This report is not sold to the general public, and only available to buyers of this book
â”â•â”â•â”â•â”â•â”â•â”â•â”I wish I knew all this information years ago. No where else on the web will you find what I reveal in this book
Experienced chartist or brand new trader, everyone will learn new information in this book. Click the “Buy Now” button at the top of the page and get your copy right now!
Read more
£3.80 -
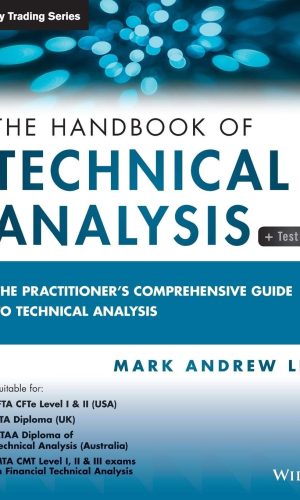
The Handbook of Technical Analysis + Test Bank: The Practitioner’s Comprehensive Guide to Technical Analysis (Wiley Trading)
A self study exam preparatory guide for financial technical analysis certificationsWritten by the course director and owner of www.tradermasterclass.com, a leading source of live and online courses in trading, technical analysis, and money management, A Handbook of Technical Analysis: The Practitioner’s Comprehensive Guide to Technical Analysis is the first financial technical analysis examination preparatory book in the market. It is appropriate for students taking IFTA CFTe Level I and II (US), STA Diploma (UK), Dip TA (Aus), and MTA CMT Level I, II, and III exams in financial technical analysis, as well as for students in undergraduate, graduate, or MBA courses.
The book is also an excellent resource for serious traders and technical analysts, and includes a chapter dedicated to advanced money management techniques. This chapter helps complete a student’s education and also provides indispensable knowledge for FOREX, bond, stock, futures, CFD, and option traders.
- Learn the definitions, concepts, application, integration, and execution of technical-based trading tools and approaches
- Integrate innovative techniques for pinpointing and handling market reversals
- Understand trading mechanisms and advanced money management techniques
- Examine the weaknesses of popular technical approaches and find more effective solutions
The book allows readers to test their current knowledge and then check their learning with end-of-chapter test questions that span essays, multiple choice, and chart-based annotation exercises. This handbook is an essential resource for students, instructors, and practitioners in the field. Alongside the handbook, the author will also publish two full exam preparatory workbooks and a bonus online Q&A Test bank built around the most popular professional examinations in financial technical analysis.
Read more
£69.40£84.60 -
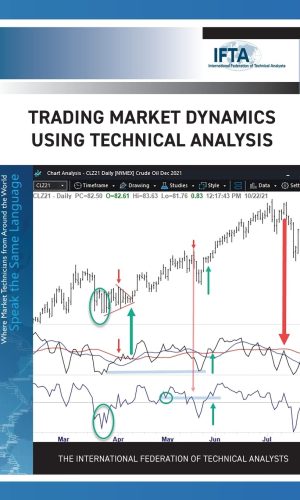
Trading Market Dynamics Using Technical Analysis
Trading Market Dynamics Using Technical Analysis by Constance M. Brown
Summary: Now required reading for CFTe certification Level 1 and 2 by the International Federation of Technical Analysts. Applied technical analysis is different than theory. The interaction of signal, timing, and confirmation is critical in today’s markets. Trading Market Dynamics is a detailed progression of methods that lead to a final chapter showing how they are used for trading daily intraday signals in a trader’s log from January 1-31, 2022. The methods apply for longer horizon positions or short intraday swings. The 10th book by well known author.
Chapter One – Markets or stocks should not be traded as a single symbol. There is always a leading trend to lean on using another market. The global cash flow discussion will show you how to compare markets in detailed charts.
Chapter Two – A two-part chapter that covers classic cycles. It is written in two parts as the material will become required for CFTe levels 1 and 2. Other content is being evaluated for certification.
Chapter Three – How to use MS Excel as a step-by-step guide to examine market correlation objectively.
Chapter Four – Crowd psychology and the market pressure patterns they create.
Chapter Five – Essential and written to correct industry misunderstandings and under-utilization of oscillators. Includes original charts and text of George Lane’s original week long course. Understand why you need both normalized and unbound oscillators in volatility. Learn why the best signals are NOT divergence signals but formations that repeat in the mid-range of travel giving signal probabilities.
Chapter Six – Needed to understand Brown’s entry/exit and risk assessment criteria.
Chapter Seven – This chapter tracks the entire month of January 2022 in an daily intraday trading log of NASDAQ. All the logic, study and prep each evening, then trading as a running dialog written in real-time. Time periods drop from daily down to 4-minute charts as needed. It became a period of market transition that required most of the methods described earlier in the book. The chapter in retrospect shows how applied technical analysis is used in battle during an historic rollover in the NASDAQ.
FULL COLOR, 398 pages, 8.5 by 11 inches, 2.8 pounds.
(Beginner to Intermediate level)-provided by the Author.
ISBN-978-0-578-38286-9 (alk. paper)
1. Investment analysis. 2. Speculation. 3. Technical Analysis.
Read more
£20.30 -
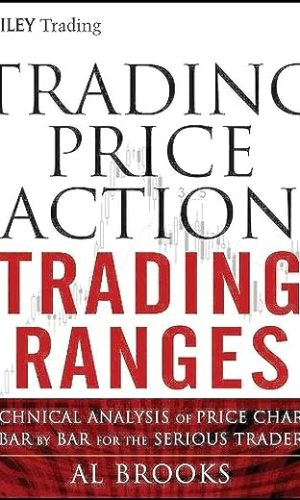
Trading Price Action Trading Ranges: Technical Analysis of Price Charts Bar by Bar for the Serious Trader: 521 (Wiley Trading)
Praise for Trading Price Action Trading Ranges“Al Brooks has written a book every day trader should read. On all levels, he has kept trading simple, straightforward, and approachable. By teaching traders that there are no rules, just guidelines, he has allowed basic common sense to once again rule how real traders should approach the market. This is a must-read for any trader that wants to learn his own path to success.”
―Noble DraKoln, founder, SpeculatorAcademy.com, and author of Trade Like a Pro and Winning the Trading Game“A great trader once told me that success was a function of focused energy. This mantra is proven by Al Brooks, who left a thriving ophthalmology practice to become a day trader. Al’s intense focus on daily price action has made him a successful trader. A born educator, Al also is generous with his time, providing detailed explanations on how he views daily price action and how other traders can implement his ideas with similar focus and dedication. Al’s book is no quick read, but an in-depth road map on how he trades today’s volatile markets, complete with detailed strategies, real-life examples, and hard-knocks advice.”
―Ginger Szala, Publisher and Editorial Director, Futures magazineOver the course of his career, author Al Brooks, a technical analysis contributor to Futures magazine and an independent trader for twenty-five years, has found a way to capture consistent profits regardless of market direction or economic climate. And now, with his new three-book series―which focuses on how to use price action to trade the markets―Brooks takes you step by step through the entire process.
In order to put his methodology in perspective, Brooks examined an essential array of price action basics and trends in the first book of this series, Trading Price Action TRENDS. Now, in this second book, Trading Price Action TRADING RANGES, he provides important insights on trading ranges, breakouts, order management, and the mathematics of trading.
Page by page, Brooks skillfully addresses how to spot and profit from trading ranges―which most markets are in, most of the time―using the technical analysis of price action. Along the way, he touches on some of the most important aspects of this approach, including trading breakouts, understanding support and resistance, and making the most informed entry and exit decisions possible. Throughout the book, Brooks focuses primarily on 5 minute candle charts―all of which are created with TradeStation―to illustrate basic principles, but also discusses daily and weekly charts. And since he trades more than just E-mini S&P 500 futures, Brooks also details how price action can be used as the basis for trading stocks, forex, Treasury Note futures, and options.
Read more
£49.90£56.10

