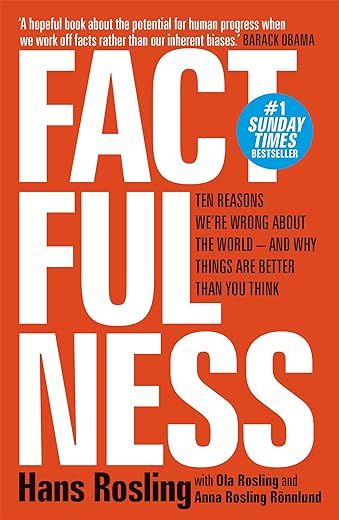
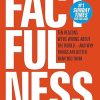
Factfulness: Ten Reasons We’re Wrong About The World – And Why Things Are Better Than You Think
£6.99£10.99 (-36%)
‘One of the most important books I’ve ever read – an indispensable guide to thinking clearly about the world’ BILL GATES
‘A hopeful book about the potential for human progress when we work off facts rather than our inherent biases’ BARACK OBAMA
The international bestseller, inspiring and revelatory, filled with lively anecdotes and moving stories, Factfulness is an urgent and essential book that will change the way you see the world, and make you realise things are better than you thought.
*#1 Sunday Times bestseller * New York Times bestseller * Observer ‘best brainy book of the decade’ * Irish Times bestseller * audiobook bestseller * Guardian bestseller *
Read more
Additional information
| Publisher | Sceptre, 1st edition (27 Jun. 2019) |
|---|---|
| Language | English |
| Paperback | 352 pages |
| ISBN-10 | 147363749X |
| ISBN-13 | 978-1473637498 |
| Dimensions | 12.9 x 2.1 x 19.8 cm |




by alan pretsell
Really good read
by Sherlock
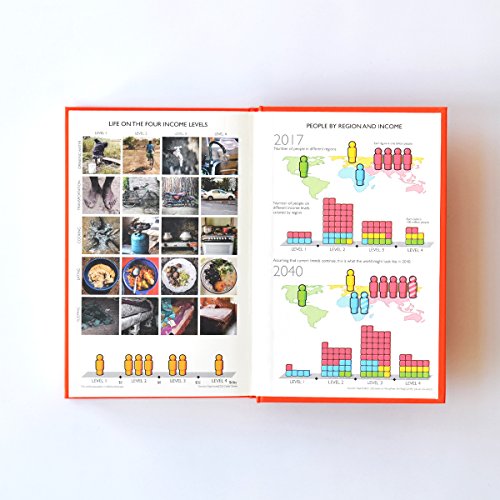
This is quite an interesting, original format for presenting information. The world’s population is broken down into 4 income levels, (1-4), of which the reader is presumed to be in the highest one, on account of being able to buy the book.
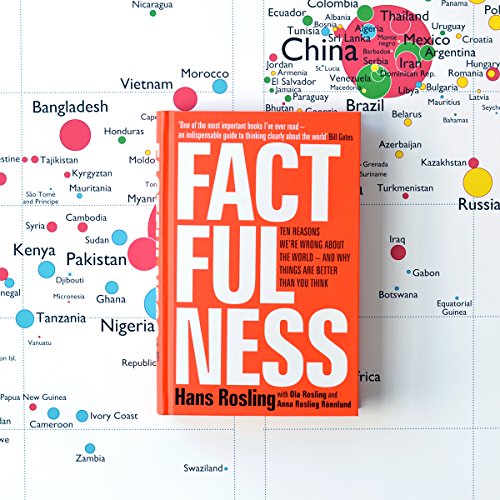
Hans tests our knowledge by giving multi choice questions, of which we and the students he has taught are led to believe are the most pessimistic answers. He then goes on to demonstrate, with the aforementioned bubble charts that show that extreme poverty is ‘only’ limited to a billion people, and that, over time, people are moving up the income ladder.
He uses 10 concepts to illustrate how we are to interpret data, there is a useful device of a symbol to represent the chapter which, by the end of it is put in context. For example on Size, an elephant is shown, but at the end, an even bigger one is shown to give comparison.
We are advised to compare and divide numbers when they are shown to support an argument, I often do this with, eg, NHS spending by dividing by the population. Plus, don’t just take one figure, obtain comparable figures.
A little optimistic at times, not enough focus on the effects of a growing population.
by Lynn Huddart
Just the read I’ve been looking for. I regularly shout at the news ‘just tell me the facts’ when in truth I’m responsible for my own fact finding, to push my own perceptions and to better understand. There is definitely a peace to be had if we take a moment to reflect and consider what we are looking at before we make our decision and to keep challenging in a world that just keeps changing, mostly for the better.
by Rosemary Standeven
“If you are more interested in being right than continuing to live in your bubble; if you are willing to change your worldview; if you are ready for critical thinking to replace instinctive reaction; and if you are feeling humble, curious and ready to be amazed – then please read on.”
I am a student of mathematics, and while the main focus of my study is Pure Maths, I love statistics too, and believe it is the most important area of mathematics taught in secondary school, and that an understanding of statistics is vital for understanding the modern world we live in.
“The world cannot be understood without numbers. But the world cannot be understood with numbers alone.”
Hans Rosling first came to my notice when I saw him speaking about statistics on TV. I taped the program and showed it to my pupils when I was a maths teacher – they (like me) were transfixed by his bubble graphs: ‘Why can’t we do stats like this?!’. Learning about statistics at school is often boring – this is riveting and so relevant. Especially today, when the news is saturated with statistics and graphs about the COVID pandemic and vaccines, and where it is become increasingly difficult to discriminate between facts and fake news.
Rosling’s background is in medicine, and he came to statistics as a way of improving his medical practice, and understanding the lives and needs of his patients. He worked extensively in Africa, as well as in his home country of Sweden, and many of his examples come from these two very different places.
The book is divided into 10 main chapters: Gap (look for the majority); Negativity (expect bad news); Straight line (lines might bend); Fear (calculate the risks); Size (get things in proportion); Generalisation (question your categories); Destiny (slow change is still change); Single (get a toolbox); Blame (resist pointing your finger); and Urgency (take small steps)
His main thesis is that – despite what many of us believe – things are getting better all over the world. Yes, they may still be bad, and there may need to be much more change, but things are improving. Only dramatic news hits the headlines, but there are so many small, incremental positive changes happening every day.
“don’t confuse slow change with no change. Don’t dismiss an annual change—even an annual change of only 1 percent—because it seems too small and slow.”
Only by looking at the facts and statistics can we understand the true situation, and plan for further improvement.
“Being curious means being open to new information and actively seeking it out. It means embracing facts that don’t fit your worldview and trying to understand their implications. It means letting your mistakes trigger curiosity instead of embarrassment.”
The book begins with a multichoice test – how much do you know about the world (poverty, life expectancy, population, education, health) – and can you score better than a chimpanzee picking answers at random. Often, the chimps do better, because our choices are skewed by outdated knowledge, unconscious prejudices and an emphasis on dramatic, often negative, news. Throughout the book the reasons behind the correct answers are explained, and also reasons behind some incorrect choices.
“Beware comparisons of averages. If you could check the spreads you would probably find they overlap. There is probably no gap at all. • Beware comparisons of extremes. In all groups, of countries or people, there are some at the top and some at the bottom. The difference is sometimes extremely unfair. But even then the majority is usually somewhere in between, right where the gap is supposed to be.”
But numbers alone cannot tell you everything. You need to be aware of how the numbers were obtained, what categories were used, and who compiled the statistics and why.
“Never, ever leave a number all by itself. Never believe that one number on its own can be meaningful. If you are offered one number, always ask for at least one more. Something to compare it with.”
“If someone offers you a single example and wants to draw conclusions about a group, ask for more examples. Or flip it over: i.e., ask whether an opposite example would make you draw the opposite conclusion.”
“when presented with new evidence, we must always be ready to question our previous assumptions and reevaluate and admit if we were wrong.”
For the future
“We should be teaching our children that there are countries on all different levels of health and income and that most are in the middle. • We should be teaching them about their own country’s socioeconomic position in relation to the rest of the world, and how that is changing. • We should be teaching them how their own country progressed through the income levels to get to where it is now, and how to use that knowledge to understand what life is like in other countries today.”
“We should be teaching them that people are moving up the income levels and most things are improving for them. • We should be teaching them what life was really like in the past so that they do not mistakenly think that no progress has been made. • We should be teaching them how to hold the two ideas at the same time: that bad things are going on in the world, but that many things are getting better. • We should be teaching them that cultural and religious stereotypes are useless for understanding the world. • We should be teaching them how to consume the news and spot the drama without becoming stressed or hopeless. • We should be teaching them the common ways that people will try to trick them with numbers. • We should be teaching them that the world will keep changing and they will have to update their knowledge and worldview throughout their lives.”
There is so much in this book for everyone to learn, so many good quotes and examples that I did not have space to include. This book should be required reading for everyone. It will challenge you, inform you and fascinate you – but it will not leave you unchanged.
I listened to the audio book, which came with a pdf containing the quiz, graphs, pictures and short chapter summaries. I also bought the e-book. Whatever format you prefer, I urge you to read this very important book. Highly recommended to everyone.
by Brian Clegg
Without doubt a remarkable book. Hans Rosling (who died towards the end of writing Factfulness), aided by his son and daughter-in-law, tells the remarkable story of the gap between our appreciation of the state of the world and the reality.
Rosling, a doctor originally, illustrates some of the points he makes with personal experience, particularly examples where an incorrect assumption about facts he has made has led to potentially disastrous circumstances. But the core of the book makes use of a series of 12 multiple choice questions on the state of the world which, on the whole, we answer worse that choosing randomly – because almost universally we think the world is far worse than it really is.
Although Rosling claims not to be an optimist, making it clear that he isn’t saying everything is rosy – there’s still a lot to improve – the fact is that most of our ideas of, for example, how bad world poverty is, education of girls, size of families and far more reflects what the world was like 50 years or more ago – where in practice it is now much better.
One essential point that Rosling makes is that our division of the world into developing and developed gives a hugely misleading picture – because in reality (like most distributions) the majority of countries aren’t in the very worst or very best part of the distribution, but somewhere in the middle. He advocates moving from the either/or split of developed/developing to four levels, based on average earnings, which gives a much better picture of the reality. Apparently the World Bank has adopted this approach but the UN and others still haven’t got the message.
In Factfulness, Rosling looks at a set of ways we have a biased view of reality and what we can do to modify this. So, for example, he talks about our urge to divide populations into two (‘the gap instinct’) – rich or poor, privileged or not etc, etc. – where the reality is almost always a continuum with no gap. Elsewhere he takes on our tendency to extrapolate into the future with a straight line, where many trends are, for example S-shaped, the danger of always looking for someone to blame and much more.
This is a very powerful piece of work that should be required reading for any politician, businessperson, educator and administrator. The whole thing is presented in a light, approachable fashion with lots of graphs and bubble charts. It’s an easy read practically speaking, but a difficult one in the sense that the reader is encouraged to face their own misconceptions (and we almost all will have them – I certainly did).
It’s a shame there isn’t a bit more on implications. For example, how we target aid would perhaps change if we took note (in the UK, for example, our biggest aid recipient is not a Level 1 country). I also occasionally felt that (for all the right reasons) the wording of the questions used to evaluate our views was a little manipulative to get the required results. And although Rosling warns of the danger of lone numbers without context, he has a tendency to use percentages without context – which is also potentially highly misleading. (For example, if violent crime rises 100% in a year it’s terrifying. But if you know there was 1 incident the previous year and 2 this year, it’s not so dramartic.)
Just one example of the slightly weighted questions: one reads ‘In all low-income countries across the world today, how many girls finish primary school?’ The options are 20, 40 or 60 percent. Rosling’s ‘right’ answer is 60 percent, then later he tells us ‘there are only a very few countries in the world’ where fewer than 20 percent of girls finish primary school. The trouble is, that word ‘all’ in the question. I’d argue the logical answer is 20, because that’s the only number that applies to all countries – if larger numbers complete primary school, then 20 percent certainly do. It can’t be true that 60 percent finish in all countries if under 20 percent do so in some.
These are, however, minor concerns – Rosling and his associates have a powerful message that needs shouting from the rooftops.